Business Sales Performance Analytics Dashboard
Built a Power BI dashboard to analyze sales, profit, and regional performance, delivering actionable business insights through data visualization.
Preview Gallery
6 media
Technologies & Skills
Tags
Download at no cost
What's Included
Support & Customization
Resource Links
The Business Sales Performance Analytics Dashboard is a data analytics project developed using Power BI to help businesses monitor and analyze their sales performance. The dashboard transforms raw sales data into meaningful visualizations, enabling users to understand business trends and make informed decisions.
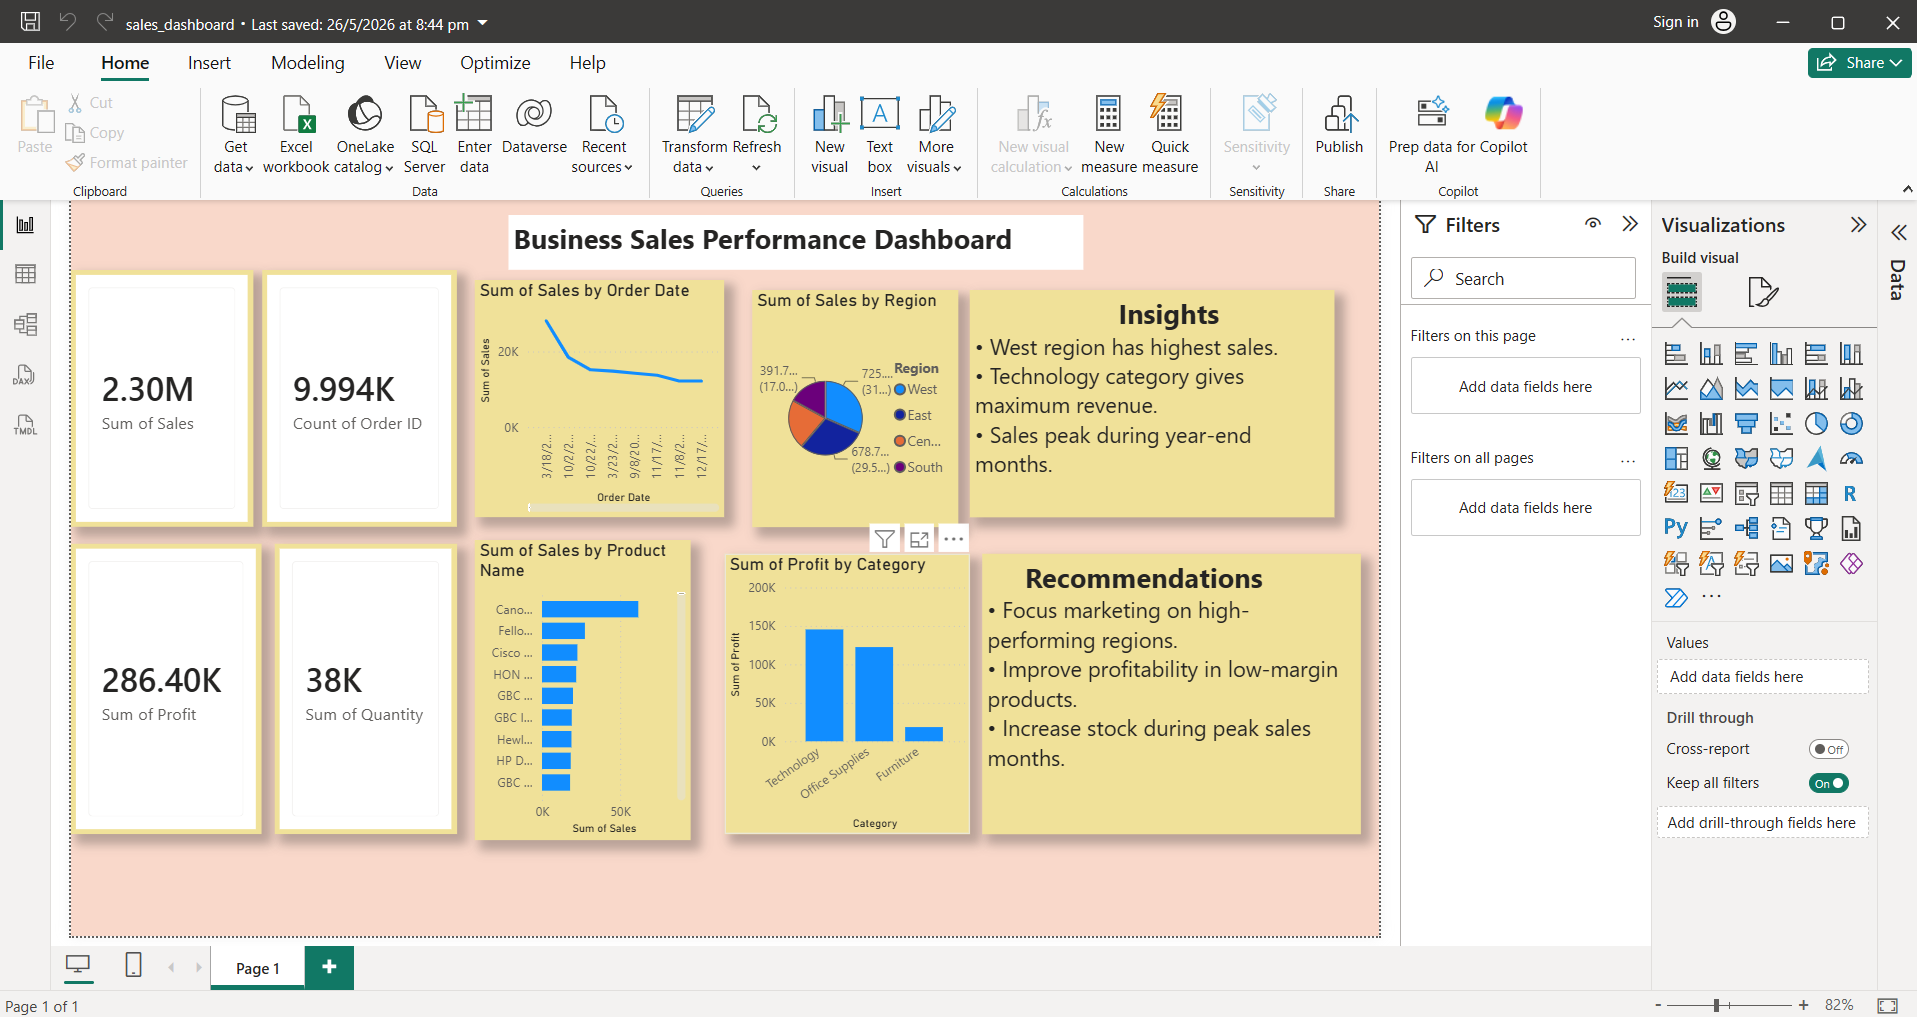
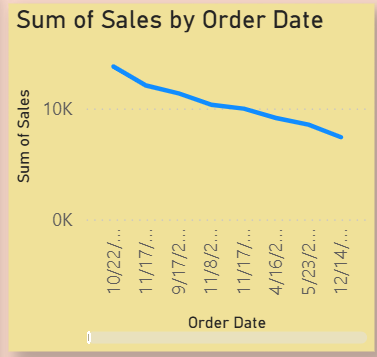
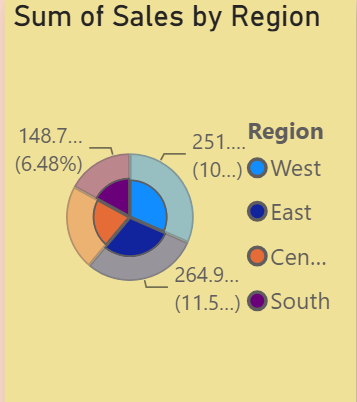
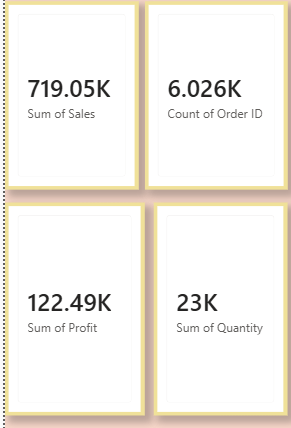
The project involves data cleaning, preprocessing, and exploratory data analysis (EDA) to ensure accurate and reliable insights. Key performance indicators such as total sales, profit, order count, and quantity sold are displayed through interactive KPI cards and charts. It also provides detailed analysis of regional sales, product performance, sales trends over time, and category-wise profitability.
Based on the analysis, the dashboard generates actionable business insights and recommendations, such as identifying top-performing regions, high-revenue product categories, and peak sales periods. These insights help businesses improve marketing strategies, optimize inventory management, and increase profitability.
This project is designed for business owners, sales managers, and data analysts who need an interactive and easy-to-understand dashboard for tracking business performance and supporting data-driven decision-making.
Technologies Used: Power BI, Python, Pandas, NumPy, Microsoft Excel.
Future Enhancements
• Add real-time data integration.
• Include predictive sales forecasting using Machine Learning.
• Develop customer segmentation analysis.
• Add interactive filters and drill-through reports.
• Integrate SQL database connectivity.
• Publish the dashboard on Power BI Service for online access.
Known Issues
The dashboard is based on historical sales data and requires dataset updates to reflect the latest business performance. Some visualizations may require refreshing when the dataset is modified.
Installation
1. Install Microsoft Power BI Desktop.
2. Download and extract the project files.
3. Open the Business_Sales_Dashboard.pbix file in Power BI Desktop.
4. Ensure the dataset file is available in the specified location.
5. Refresh the dataset if prompted.
6. Explore the interactive dashboard using the available charts and filters.
Usage
1. Open the dashboard in Power BI Desktop.
2. View key performance indicators including Sales, Profit, Orders, and Quantity.
3. Analyze sales trends over time using the line chart.
4. Compare regional sales performance using the pie chart.
5. Review category-wise profit analysis through the bar chart.
6. Use the insights provided to understand business performance and support decision-making.
System Requirements
Operating System: Windows 10 or later
Software:
• Microsoft Power BI Desktop
• Microsoft Excel (optional)
Processor:
Intel Core i3 or above
RAM:
Minimum 4 GB (8 GB Recommended)
Storage:
At least 500 MB free space
Slides Open in New Tab
For better readability, slides are opened directly. Documents remain preview-only with secure backend rendering.
Showing preview pages only. Purchase for full access to all pages and complete source package.
Login for Full AccessNo Q&A available yet
Be the first to ask a question!
Ask a Question
Customer Reviews
Write Your Review
No reviews yet
Be the first to review this project!
Similar Projects
You might also be interested in these projects
 Data Science & Analytics
Aqua Analytics
Aqua-Analytics: A Data-Driven Insight into India's Drinking Water Accessibility - From Coverage Metrics to Implementation Integrity.